Showing posts with label function. Show all posts

Saturday, October 26, 2013

Improvements Graphing Piecewise Functions

My PreCalc kids did better graphing piecewise functions this year than in the past, so there's a chance I actually improved at teaching this topic.  Just a couple notes (more for myself, so I don't forget this next year):

  1. Draw a vertical, dotted "wall" at the possible point of discontinuity.
  2. Determine which piece(s) of your function will have a closed circle at your wall and which one(s) will have an open circle.
  3. Determine which function you'll use for all your x's to the left of the wall and which function you'll use for the right.
  4. Graph the top function (use transformations); erase everything to the left or the right of your wall, depending on your decision from Step 3.
  5. Repeat Step 4 for the bottom function.  Erase the oppose piece this time.


The key, for me, is "the wall."  I've used this concept before in analyzing limits in calculus graphically, but I don't know why it didn't dawn on me to use the same concept here until recently.  It worked like a charm--hardly any students drew the nonsensical, non-function relations that I've seen in the past.  Also, hopefully this gives us a leg up when we get to limits next semester.  Fingers crossed!

Sunday, April 7, 2013

My Unit on Rational Functions (Algebra II)

Disclaimer--this unit is fast and very calculator-heavy.  It would need a good deal of reconstruction for an Advanced Algebra II course.  Nevertheless...

Part I:
Review of asymptotes via Asymptote Bingo

Part II:
Introduction to rational functions via this foldable:


*I think you could use this in an Interactive Notebook if you just deleted Example 3.

Part III:
Exploring rational functions via Desmos

This was my favorite.  Oh, Desmos, how I love thee.  I wrote this literacy/technology activity for my students and then we headed to the Math Lab together to work on the computers:


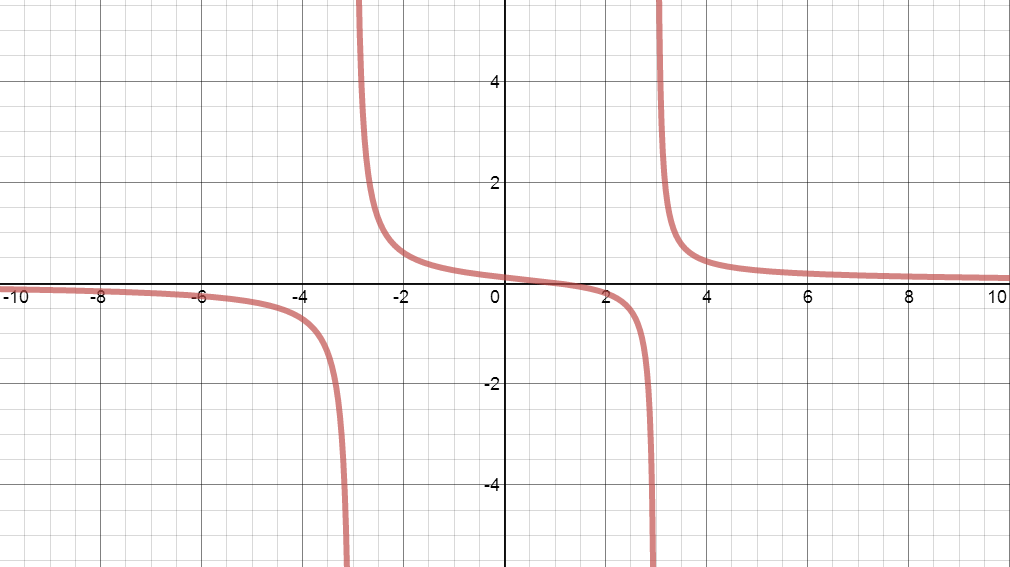
We have really nice, big screens in the Math Lab so the kids were able to get beautiful and clear pictures of these functions, which (I think) a typical handheld graphing calculator can't quite provide.  Here's what I loved:  The kids would graph the function in question, for example this:


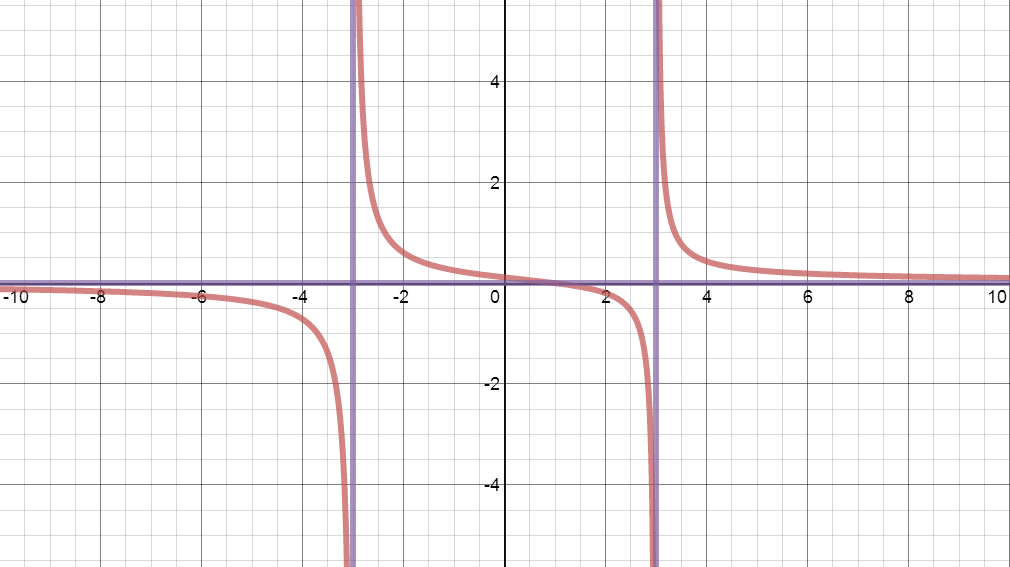
And then they were asked to analyze.  I asked them to graph all their asymptotes and highlight all intercepts.  So, if they accidentally said that the horizontal asymptote was x=0, when they graphed their answer, they (usually) immediately identified their mistake and made the appropriate corrections.  (Or, at the very least, they raised their hands and told me, "This doesn't look right to me...")  If done correctly, their ending picture should have looked something like:


So beautiful and clean!

Part IV:
Solving rational equations through graphing and technology

Including review and assessment, I spent just over a week on this unit (like I said, it was fast).  But I'm pretty happy with it--especially our day in the Math Lab.  I worked out some issues with the activity, so I'm interested to use it again (I want to try it in PreCalculus) and see how it goes the second time around.

Sunday, March 31, 2013

Asymptote Bingo

We're starting rational functions next week in Algebra II, but I knew my kids weren't super strong with asymptotes yet.  Truth be told, we still have a hard time recognizing that vertical lines will be an x=____; horizontal will be a y=____.

So, we played some Bingo on Friday, and I'm hoping for a solid start on rational functions tomorrow.

We play Bingo a good deal in Algebra II, so the kids are pretty familiar with my set-up by now.  Here's how we do it:

  1. On a personal whiteboard, draw four horizontal lines and four vertical lines, creating a 5x5 game board.  Mark the middle box as your FREE SPACE!
  2. Fill in  your board with these equations.  You may fill them in however you'd like, but you must use all 24 boxes--so keep track as you go!


Now we're ready to play!

I showed a graph of a function and then told the kids to cross out the correct asymptote.  The first several functions were strictly exponential and log functions--which we've already studied.  Anytime someone got a Bingo, s/he got a piece of candy (thank you, dear parents and guardians).  We played all hour, which gave nearly every kid a chance to get at least one piece of candy.  I kept track of the equations we had used and had the students call off their equations so I could check their answers.

After awhile the students started asking, "When are we going to get to the ones with two or three equations?  I need one for a Bingo!"

Mwahahahahaaaaa!  They were asking to learn about rational functions, and they didn't even know.

Before they knew it, they were analyzing the asymptotes of rational functions without any real instruction from me.  Just good progressions from what they already knew to what they needed to learn.

And now I feel at least a little better about their knowledge of asymptotes.

If you want the Notebook Bingo file, click here.

Sunday, October 7, 2012

Function Transformations/Domain and Range: Day 2 (and a bit more)

Day 2:  Domain and Range of Parent Functions

I started the year with domain and range of a finite set of points, because, it's an easy concept and I wanted my students to know--Algebra II is totally conquerable.

Fast forward a month, and I think they might just ready to handle a continuous case.  We broke it up sloooooowly and built towards finding the domain and range of the four functions they found the day before.

Domain and Range

Obstacle #1:  Closed circle v. Open Circle
I really enjoyed this part of the lesson because the students were totally in to the closed circle v. open circle, which is awesome...but not before we jumped over a few hurdles.  When I asked them what an open circle denotes in mathematics, a few people proudly reported, "Parenthesis!"

No, sweethearts, an open circle does not mean parenthesis, last time I checked the dictionary.

So, we got to talk about my favorite branch of all--analysis.[1]  How could we write all the numbers between -5 and 4, but not including -5 (see fourth slide above)?  Of course, [-4.9, 4] was suggested.  But then poor -4.99 (just to mention one) gets left out!  Any number they suggested that was close to -5, but bigger, I could always find a number that was even closer (thanks, density!).

Hmmm...

And then a kid suggested something that was absolutely brilliant.

Incorrect, but brilliant nonetheless.

"Could we use -4.999...?"

Cue look of How far do I dare take this subject with these kids?

I wasn't quite sure.  And still am not so sure.  I decided to write this on the board:

-4.999... = -5

"This is what we know, and can prove, mathematically:  that -4.9 repeating is equal to -5.  So, sadly, writing [-4.999..., 4] does not help our quest because that's the same as [-5, 4], which is what we were trying to avoid in the first place."  BRILLIANT thought though, loquacious kid in the front row.

So, new notation is all that we could come up with in order to fix this dilemma.  Parenthesis.  As was wildly suggested before.

Now if only they could remember a few of the deeper ideas as opposed to just "open circle=parenthesis."

Obstacle #2:  Domain of Deceiving Functions
Here's what I mean by a deceiving function.  I took y=x^3 and showed a graph like this:

Graph Plot

Most students were convinced that the graph would never pass x=-3 on the left, and x=3 on the right; hence the domain must be something like [-3,3].  And who can blame them?  They haven't developed a good sense for what the graph of a function is yet.

But that's ok.  Because we have Desmos.

So, to abettercalculator.com we went to graph the function, along with the line x=-3:


The kids' case was looking good.  Until we started scrolling down:


And down...

Aw, isn't that a lovely linearization...

And changing the y-axis view even more...
Gah!

And this convinced many (though not all)...the domain is indeed all real numbers.

Days 3-5 were spent focusing on vertical and horizontal translations.  We tried vertical stretching/shrinking, too, but I started to lose several of them, so I decided parent functions, domain/range, and translations were plenty for now.  We can come back for the rest later.  That's the beauty of 180 days, as opposed to the 48 that I'm used to.

Before the unit test, we played Kate Nowak's Speed Dating Game, but I adjusted it for these topics.  You can find the game cards I created here.

[1]  I claim analysis/advanced calculus as my emphasis in grad school...mostly because that's what I took the most classes in and that's what I took my written comprehensive exams in.  In any case, while I can't say I've read that many texts on analysis, I can say, that Understanding Analysis by Stephen Abbott is, by far, the best text I've ever seen on introductory analysis.  All calculus teachers should be required to read it.  Truly!  It's the best.  Get the whole thing for free here.  Go.  Read.  ENJOY.  He's a master teacher.

Monday, September 10, 2012

Week 4 :: Writing Piece-wise Functions

A prompt for the final week of the New Blogger Initiation was to write about another new blogger's post.

Maggie (@pitoinfinity8) posted an awesome activity for piece-wise functions in which students literally cut up the different pieces of a given function and then puzzle them together.  Brilliant.  In response, Bowman Dickson mentioned that it might be useful to go the other way, too; in other words, give the students the graph and have them write the equation.

I love both these ideas:  the first gets the students to read; the latter gets them to write.  I didn't read Maggie's post until after I introduced piece-wise functions this year in Pre-Calc, but I did read it in time for our first test review.

So, here's what we did...


I gave them a few minutes to answer these questions and then we used their answers along with the restrictions to write the function.

Onto another one:

They were rockin and rollin, so I asked them...


This time, I gave them the problem in the traditional manner:


Success!  Finally!  Many thanks to Maggie and Bowman.  What a great way to review both piece-wise functions and function transformations.

Speaking of function transformations, a twitter conversation in which I laughed out loud:


Wednesday, August 1, 2012

I heart these two calc problems

These were both AP Calculus sample questions for 2012.  And I just really like them:


Friday, July 20, 2012

M&Ms and the Population of Afghanistan

In Business Calc, we're currently studying exponential growth and decay.  I'm rather excited about this since it's something we study in College Algebra, too, and I feel--because it's material I've taught before--that I can expand a bit.  I'm learning that it's really, really hard to expand (i.e., go beyond an absolutely dazzling lecture *cough*) when I'm teaching a class for the first time.  I sort of feel like I did my first semester as a TA:  I just hope I don't screw something up too terribly. But--you gotta start somewhere, right?!

Anyway.  Back to exponential growth/decay.  In College Algebra, when we study exponential functions, I have my students model the decay of an M&M population.  I had planned to do this with my Business Calc class as well.  Then Bowman Dickson posted places to find awesome data, which made me want to use data the UN has on the world's populations instead.

The question:  How to relate M&M's to population growth or decay?

The answer:  I'm not entirely sure.  Here's what we did though...

We started out with the M&M project as in College Algebra.  Each team found the exponential regression (in the form y=ab^x) and the r^2 value for their data.  We talked about the meaning of a and b.  Then I asked them to convert their regressions to the form P(t)=P_0e^(kt), which turned out to be very close to the trendlines Excel found (yay!).  We talked about what k would mean if it this were a real population and how it's related to the derivative.

Now the challenge:  I asked them to do the same types of calculations for an actual population, using data from the UN.  They were on their own for this project, which may or may not have been a great idea.  Below is what they had to go off of.  I focused mainly on finding the exponential regression on a TI as well as understanding growth/decay rates.  But there's much, much more to do here (Bowman does a week-long project!).

And here's the project!

Population Growth or Decay Instructions

Monday, April 2, 2012

Exponential/Log Function Review Day + Napier!

I've written before about how review days are a continual source of stress for me.  To review or not to review? that is the question.  And if to review, how do you make it interesting and beneficial for the upcoming test?  I have no profound answers yet.  But, I am putting a lot more time and effort into my review days now (mostly because I've taught College Algebra enough times so that I have the extra time to do that).

That said, I've been very much looking forward to this review day for quite some time.  The unit has been on exponential and logarithmic functions.  When I talk to my husband about this unit (who patiently listens to all my teacher talk--I found a really good man, let me tell you) he always reminds me, "It would be much less scary if it weren't called a LOGARITHM."

And he's completely correct.

So, I've been hyping up this review day nearly all unit:  "We'll talk about who invented logarithms, why in the world he did so (just to make your lives miserable?), and why they're called what they're called."

Here are the slides that took us through a short history of logs.  The SMART notes didn't convert perfectly to PowerPoint, but email me if you want the SMART notes as well.

I gave the students a sheet that corresponded with the notes so they could follow along.
After we went through John Napier's method of multiplying two numbers we worked the same multiplication on slide rules!  A few of my colleagues were kind enough (and...ahem...old enough) to loan me enough slide rules so that nearly every student could have his/her own for the day.
Next, as review for the test and as further proof of how quickly exponential functions grow, I had the class break into four groups and choose one of the following problems below.  I got the first problem from Ethan Siegel's blog.
Unit 4 Review Problems


We ended with a short wrap-up of the big ideas of this unit.

Thursday, March 29, 2012

Exponential Regressions: M&Ms


M+Ms by HazeyNut
I think this idea originally came from Virginia Tech, but I may be wrong.  In any case, here's how we did exponential regressions in College Algebra this semester.

Each student gets a "Fun Size" bag of M&Ms.  Students divide into teams of 3-4.  Each team gets a napkin that they're asked to unfold completely.  The teams spill out their M&Ms on their napkins, making sure all candy pieces are lying flat on the napkin.  Now for the math...
  1. Count the total number of M&Ms on the napkin (this will correspond to x=0, where x is the number of "shakes").
  2. Fold the napkin over the M&Ms and shake, shake, shake so that the candies get mixed up well.  When done, make sure all pieces are lying flat.  Take away any M&Ms that don't have the M facing up.  Eat them.  Now count how many M&Ms are left (this will correspond to x=1).
  3. Fold up the napkin, shake, remove M&Ms that don't have the M facing up, eat them, and count the leftovers (x=2).
  4. Repeat Step 3 until M&Ms are gone.
After each turn, I asked all teams to tell me how many M&Ms were left, and I inputted their results into an Excel spreadsheet, which was being projected on the board.  I created a template so that with each number I inputted, a scatterplot began to form.  [Download the template.]  After five turns, one group's data (whose M&Ms cooperated quite nicely) looked like this:


After the M&Ms were gone, I asked each team to find an exponential regression using their graphing calculators that fit their particular data (they could look up at the Excel spreadsheet, where the data had been recorded for them).  In a perfect world, their regressions would look something like y=a(0.5)^x, where a is the number of M&Ms they started with.  Of course, the number of M&Ms doesn't diminish perfectly to half its previous size every time, so we got results that looked more like this (again, this was a rather good trial):


But the imperfection is good.  For one, that's life.  For two, it makes it a little less obvious as to what's going on and creates a nice starting point for some discussion.

After the students gave me the regression equations, I plotted the regressions on Excel (which you can do easily in just a couple clicks).  I asked which team looked like they had the best regression and then we compared r^2 values to see if they matched the students' intuition.

I really wanted to use Skittles for this project so I could call it "Skittles:  Taste the Exponential Regression."  Alas, M&Ms were half the price of Skittles and my frugality won over.  Maybe next semester.

Tuesday, March 13, 2012

Exponential Functions: Folding and Shopping

I've never been all that happy with my presentation of exponential functions.  I usually slap a couple of functions on the board, plot some points with the class, and then write up a list of these functions' characteristics.  Boring.

Thankfully, I recently came across Sam Shah's method of exploring exponential functions using paper folding.  I like this idea so much more than plain old point-plotting (though I ask the students to do that as well).  Here's the worksheet I had my classes fill out before introducing the formal definition of an exponential function:

Paper Folding Exponential Functions


We spent 15-20 minutes on this worksheet in class before diving into the lecture.  That's a lot of time for a college class, and I felt rushed the rest of period, which is never good.  So, next semester I may assign it for homework the day before instead to save some time.  I would have to give some kind of hint as to how to find f(x) and g(x) though, because the students were a bit unsure of the pattern going on.  I don't think anyone got 2^x, but most did see that we were multiplying (or dividing) by two each time.

Once we got into the lecture part, I gave the students a great cheesy word problem:


One of my students noticed that it didn't take much time for the spending to increase significantly, which I was quite happy about.  "So the moral of the story," I began to say...

"Is not to be exponential when you're shopping!"  she finished for me. 

Perfectly said.

Wednesday, March 7, 2012

Polynomial and Rational Function Review Day

Review days are a continual dilemma for me.  After each unit is finished and before each test day, I schedule a Review/Catch Up Day.  I'm not sold on this format, but I'm not opposed to it either.  Due to the fact that we live in Oklahoma, I definitely have to have a few built-in catch up days since we close our schools and colleges at the slightest sign of snow/"cold" weather.

I've been using these built-in catch up days for review, which seems natural enough.  The downside is that I often have very low attendance on these days. So, today I tried something new.  I offered something that nearly every one of my students will come to class for:  extra credit

You would think I would have had this revelation a while ago...alas.   

Math Mama wrote about a game of "Risk Your Beginning Algebra Skills."  I really liked the idea of the students having to wager a certain amount for each given question:  they have to be honest with themselves and decide how well they think they know something before seeing the answer.  So, I adapted Math Mama's idea and made a game of "Polynomial and Rational Function Jeopardy."  Before I showed them the answer slide, I would ask which students felt confident about their answer and then I had one of these students share with the class.  They were usually right on the money.  

I chose to do this in a slideshow format as opposed to a worksheet format because I know my students well enough to know that half of them would be working ahead and hence not contributing to the overall discussion (all my students are concurrent high school juniors and seniors).  Even if the overall discussion is not always where I would like it to be, some discussion still beats no discussion.

Overall, I think this review day was a success.  Students participated and hopefully got a good sense of what they needed to study for the upcoming test.

Here's the wager sheet I gave my students in Word format and PDF format.

Friday, March 2, 2012

Exploring Rational Functions

Yet another idea I've stolen completely from Kate Nowak.  The unit we're currently working on in College Algebra is on polynomial and rational functions.  I get one day to cover rational functions.

One day to cover possibly the most fun word in all of algebra:  asymptotes.

Let's face it--the day our math teachers condoned the word ass was a good day for all of us.

Anyway, here are the lecture notes we discussed together in class.  If you haven't read Kate's post, read it first.  I didn't change much.  I just added a few things that we need to cover for our college-wide cumulative final, such as horizontal and oblique asymptotes.

I was very rebellious with this section and spent an entire day and a half on it.

4.5: Rational Functions

Monday, February 27, 2012

Discovering the Intermediate Value Theorem

Here are a couple slides that my students filled out that (I hope) helped them understand how to apply IVT to verify if a real zero exists between two given x-values.  Click slides to enlarge.


Thursday, February 23, 2012

End Behavior Activities

We're currently studying polynomial functions in College Algebra.  Here are a couple activities I've done with the students to discuss end behavior.

Activity I:  The End Behavior Game
Not only do the students get to practice the Leading Term Test, but the teacher gets to enjoy a new variety of dance.

Activity II:  The Polynomial Train
This is actually a twist on what I really did, but I think I will do it this way next time.

I'd start with a constant function (f(x)=1 in the example below) graphed using Desmo's calculator and ask a student to add a term to the function so that it would ________ to the left and ________ to the right.  The next student would be asked to add another term in order to change the function's tails to a new given end behavior.  After a few students, the function might look something like this:


So the first student was asked to add a term in order to change the end behavior so that it rises to the left and falls to the right.  The second student was then asked to add another term so that it rises to the left and to the right, etc.

I like using this calculator in class because the students can see how the graph changes as we change the output.

A final note...

One of my students showed me these hand motions and words (read from left to right) to go along with the end behaviors of polynomial functions.  He remembered it from years ago, so it must have stuck!  Maybe you've seen it before, but it was new to me.  I can just see a classroom of students taking a test and moving their arms in the air as they try to answer a question...
"Odd function"

"Even function"


"Nega..."
"...tively"

Friday, February 10, 2012

Quadratic Regressions with Angry Birds

Before we ended our discussion on quadratic functions, I wanted to introduce my students to quadratic regressions.  What better way to do this than modeling the trajectory of an angry bird?


This is the picture I projected on the screen.  There is more angry bird/quadratic function material out there on the world wide web that is better than this.  However, I couldn't find exactly what I needed with the materials I had (I wanted a screen shot of an angry bird, whose path wasn't yet finished, with a grid on top).  So, I made this one on Word using a picture I found on the internet.  Be nice.  It took much longer than one would think.

We chose some points that the top parabola passes through and then fit a quadratic regression using those points.  I then asked if the students thought the bird would hit the ice block (around (9.5, 4)).  The results for this varied depending on the class and what points they chose to input into their lists (which is fascinating).

Below gives a picture of the points we plotted in one of the classes, the quadratic regression, and the point (9.5,4), which was plotted post finding the regression.


There's more to be done here, I'm sure, but it's a fine start.

Thursday, February 9, 2012

Parabolic Path of a Flying Q-Tip

This one I owe to one of my favorite teachers of all time.  It's a game we played in physics.  What you'll need for this is a drinking straw and 3-5 cotton swabs per student.

The lesson is on analyzing graphs of parabolas.  Since we just went over function transformations, we start with parabolas in the form f(x)=a(x-h)^2+k.  In this form, students seem to have very little trouble identifying the vertex.

So we graduate to f(x)=ax^2+bx+c.  Now, where's the vertex?  I used to do an elaborate presentation, completing the square for the general case and thus getting us back to the beautiful form above, and eloquently pointing out what h and k now are.  And then I came upon this beauty:

"Where is the x-coordinate of the vertex in relation to the two zeros?"  I ask.

From here, we have a little discussion, and eventually decide to average the two zeros to come up with the x-coordinate for the vertex, which turns out to be -b/2a (horrah!).

Now we practice.  I give the students a few quadratic functions and ask them to tell me all sorts of things about its graph.  The point I try to emphasize is that once you know the vertex and the direction the the parabola opens, you know a whole host of other information (such as the axis of symmetry, the min/max value and where it occurs, where the function is increasing/decreasing, and its range).

Now for the game.  I tell the students to take out the straws and Q-tips I passed out in the beginning of class.  I play this video and tell them whoever can shoot the cat with a Q-tip gets extra credit:


I gave out three Q-tips per students, but will most likely up that to four next semester, depending on how many students I have.  The students love this part of the lesson--the athletes in the room seem to take special pride in hitting the Nyan Cat.

And now back to the math.  We talk about how the path of their Q-tip takes the form a parabola.  We discuss if a should be positive or negative.  I then give them a model such as f(x)=-4x^2+4x+25 and explain that the path of their Q-tip could be modeled by such a function, where x is the time after the Q-tip's launch in seconds and f(x) is the Q-tip's height in inches.  (No, the model isn't perfect, but the numbers are fairly easy to work with and it gets the point across.)  We play with the model a bit, finding the ever-important vertex, among other things.

In the past, I've had students shoot at me during the lecture.  They love this.  Until they have to do the homework that night and realize they caught zilch during the lesson.  So, I tried the cat video this time.  It's probably not quite as entertaining, but in the long run, I think it may work better.

Wednesday, February 8, 2012

Transformation Scavenger Hunt

Last week was the wonderful function transformation lesson.  I say wonderful with a bit of sarcasm as this section tends to overwhelm me a little every semester.

Let me tell you about symmetries.  Let me tell you about translations.  Let me tell you about reflections.  Let me tell you about stretching and shrinking.

All in under an hour.

This semester, the lesson did go a bit better, I have to say.  For one, the students seemed totally into transforming graphs of functions to make them look completely different than what they started out as.  Kudos to them.  For two, I adapted Kate Nowak's buried treasure idea to fit into our lesson.

I took the twenty-five desks in my classroom and handed out a worksheet that had this on the top:


So each desk corresponded to a point on the Cartesian plane.  I gave my students a set of points as well as a function transformation.  They were to locate the points and transform them correctly.  I told them the treasure was at the point furthest to the left, for example.  Underneath the desk, I had taped an index card that said something like, "Congratulations!  Hint 1 out of 3 correctly found."  Once they found all three cards I rewarded them by playing a favorite YouTube video of mine (which, I admit, was not math-related).

All in all, the scavenger hunt was a success!  This semester, I had the class split into groups.  Once a group felt like they had the correct point, I had them tell me their answer.  If they were wrong, I told them to try again; if they were right, I had them wait for the rest of the class to get to the right answer.  This of course forced the faster students to wait a little, but that was my only complaint about the activity.

I plan to use this again next semester when we come across function transformations again, as well as incorporate Desmo's graphing calculator, which has (wait for it) SLIDERS.